Essa é uma revisão anterior do documento!
Formatador de Relatório - ReportBuilder (Resumo do guia do desenvolvedor)
INTRODUÇÃO - Elementos básicos da interface do usuários - The Data Tree
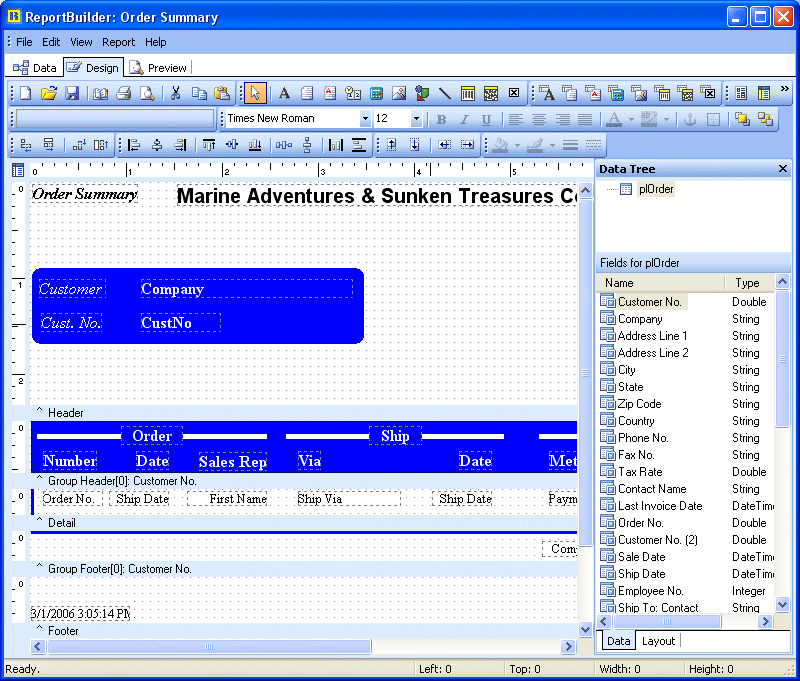
You can display the data pipelines that can be used to create data-aware components within the report by selecting the View | Toolbars | Data Tree menu option. The data tree shows a list of data pipelines in the top window and a list of fields for the currently selected data pipeline in the bottom window.
You can select multiple fields in the field list and drag them into any band. Data-aware components and corresponding labels will then be created. Notice the 'Data' and 'Layout' tabs at the bottom of the Data Tree. You can use the Layout tab to customize the behavior of the Data Tree's drag-anddrop capabilities.
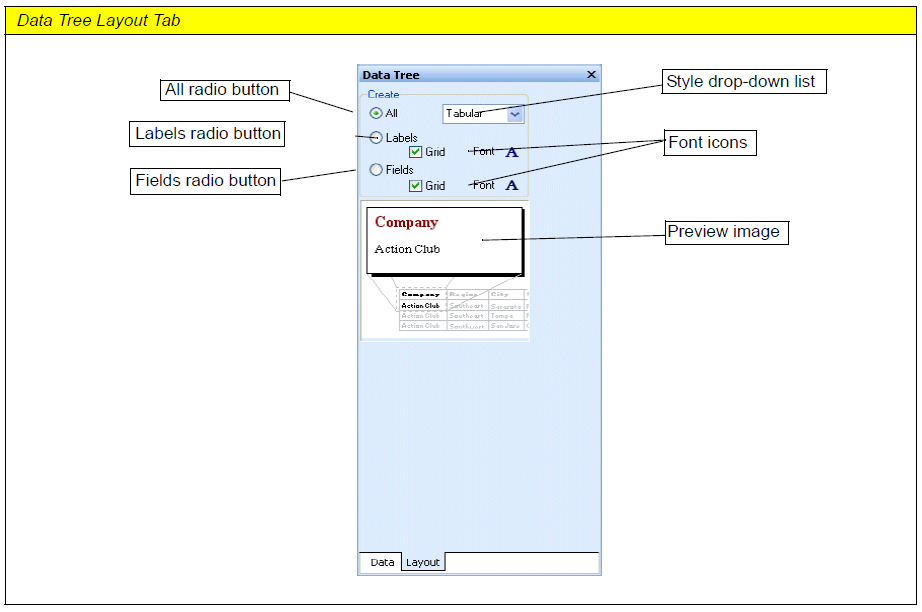
The Layout tab of the Data Tree contains many settings which you can use to customize the drag-anddrop capabilities of the Data Tree.
Style drop-down list
Controls whether the DBTextand Label components are oriented in a columnar or stacked fashion.
All radio button
When selected, both DBText components (assigned to the selected fields) and corresponding label components are created.
Fields radio button
When selected, only DBText components (assigned to the selected fields) are created.
Label radio button
When selected, only Label components (with the captions set to the field name) are created.
Grid check boxes
Controls whether a shape is placed behind the DBText or Label component.
Font icons
Controls the font name, size, style, and color via a standard font dialog.
Preview image
Shows how the created components will look.


